Concrete and its Life Cycle Part 2 / 3

In the previous part of this article series, a general overview of concrete in construction was presented. To better understand the nature of concrete, let’s take a closer look at its life cycle. 

The first stage, material acquisition (A1), involves obtaining the necessary raw materials to produce the final product. Cement is a mixture consisting mainly of clinker, which is produced in the calcination process of calcium carbonate. In this case, calcination aims to obtain calcium oxide from limestone. However, during the heating process (roasting), carbon dioxide is also produced. According to the “CO2 and Energy Accounting and Reporting Standard for the Cement Industry” report issued by the World Business Council for Sustainable Development in 2011, for every ton of calcium oxide produced, 785kg of carbon dioxide is emitted.  

1 ton of calcium oxide = 785kg of carbon dioxide 

Carbon dioxide is a by-product of the chemical process; changing the energy source needed to heat the limestone to renewable energy will reduce the amount of carbon dioxide emitted in the cement production process, but it will not eliminate it. Clinker cement will always be responsible for carbon dioxide emissions. As mentioned Part 1, in vernacular architecture, different binders were used: volcanic ash or plant extracts. Pozzolana, a type of siliceous volcanic ash, which, when mixed with lime and water, creates a waterproof, hydraulic binder. Its name comes from the city of Pozzuoli in Campania, near Naples, where there are rich deposits of the highest quality raw material. Pozzolana was well known in ancient times and described by Vitruvius in “De Architectura”

There is also a kind of powder which from natural causes produces astonishing results. It is found in the neighbourhood of Baiae and in the country belonging to the towns round about Mt. Vesuvius. This substance, when mixed with lime and rubble, not only lends strength to buildings of other kinds, but even when piers of it are constructed in the sea, they set hard under water. The reason for this seems to be that the soil on the slopes of the mountains in these neighbourhoods is hot and full of hot springs. This would not be so unless the mountains had beneath them huge fires of burning sulphur or alum or asphalt. So, the fire and the heat of the flames, coming up hot from far within through the fissures, make the soil there light, and the tufa found there is spongy and free from moisture. Hence, when the three substances, all formed on a similar principle by the force of fire, are mixed together, the water suddenly taken in makes them cohere, and the moisture quickly hardens them so that they set into a mass which neither the waves nor the force of the water can dissolve.

Interior view of the Pantheon, Rome.
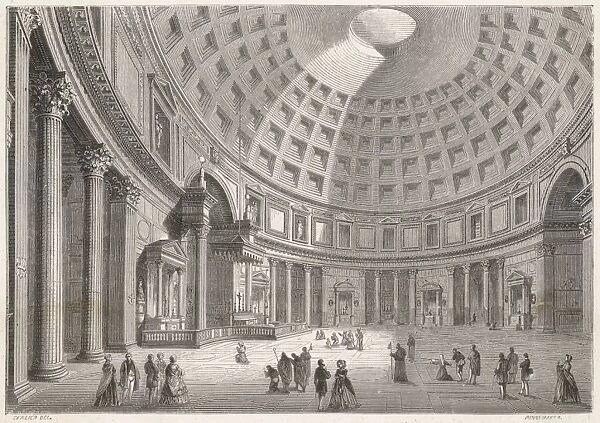
(Mary Evans Picture Library)

Bernard Rudofsky also conducted research on concrete architecture. In his doctoral thesis, “Eine primitive Betonbauweise auf den Kykladen” he focuses on the concrete architecture of the Cyclades. He points out, among other things, the relationship between the material resulting from volcanic eruptions and the architecture of the island of Santorini. His research during his doctorate laid the groundwork for the exhibition “Architecture without Architects” at the Museum of Modern Art in New York in 1964 and the publication which reminded the international discussion of the role and diversity of architecture, materials, and territory.  

If we look at the vernacular architecture of different regions, we can observe the diverse use of concrete and concrete-like materials. In ancient Mayan construction, resin extracted from endemic plants of Central America was used as a binder for mortar: chukum and jiote. When immersed in water, the bark of trees secretes a material with a high content of polysaccharides, which have binding properties. Resin, when mixed with lime, sand, and water, creates a durable mixture. Research by Carlos Rodriguez Navarro of the University of Granada indicates that cement produced in this way has similar properties to lime cement and dissolves more slowly than inorganic mortars in tropical climates. Cement produced based on organic material does not undergo the calcination process and does not release carbon dioxide into the atmosphere. An article published in 2023 reverberated loudly and opened another path for research into alternatives to cement. 

EcoCrete poured for a renovation project in London
EcoCrete with slag cement poured in London.

Ancient concrete made from volcanic ash does not meet the stringent technical standards that modern industry imposes on materials. It seems difficult to achieve C20/25 concrete using heterogeneous materials that have not undergone industrial processes. Nevertheless, an international group of researchers in an article on Santheu concrete (made with rice and egg white as binders) writes that compressive strength tests have achieved even C50 concrete. Industrial processes took a different path at the beginning of the century, focusing on optimising clinker cement. The diversity of regional solutions known from traditional construction shows that alternative solutions do not emit carbon dioxide and could replace limestone cement. They definitely require further research. Today, pozzolana or fly ash are sometimes used in mixtures of some Portland cement. Ash is a by-product and waste product of the fossil fuel combustion process. It contains small amounts of toxic beryllium and easily soluble sulphates that can seep into the groundwater system and pollute it. 

In addition to cement, concrete consists of aggregates and water. As Bjorn Berge points out in “The Ecology of Building Materials”, mainly sand, slag, and crushed stone are used as aggregates. In locations where these materials are not available, construction waste is also used, provided it does not cause undesirable reactions with the cement. To calculate the impact in the A1 process, we need to analyse the environmental costs of extracting sand and crushed stone. The “Life Cycle Assessment of Aggregates” report indicates that the biggest burden is the loading process reflected in carbon dioxide emissions, which occur during the combustion of fuel powering the machines. In the case of sand extracted from land and rivers, the Acidification (land and freshwater) index stands out negatively among the others. If we consider the EPD of prefabricated concrete columns produced by INUS in Lithuania, we can see that in stage A1, about 93% of carbon dioxide is produced in the cradle-to-gate cycle or about 90% in the cradle-to-grave cycle. Similarly, in terms of ODP, Acidification, Eutrophication of land and water, raw material, and energy consumption. Stage A2, the transport of raw materials, accounts for less than 0.1% of the total life cycle. 

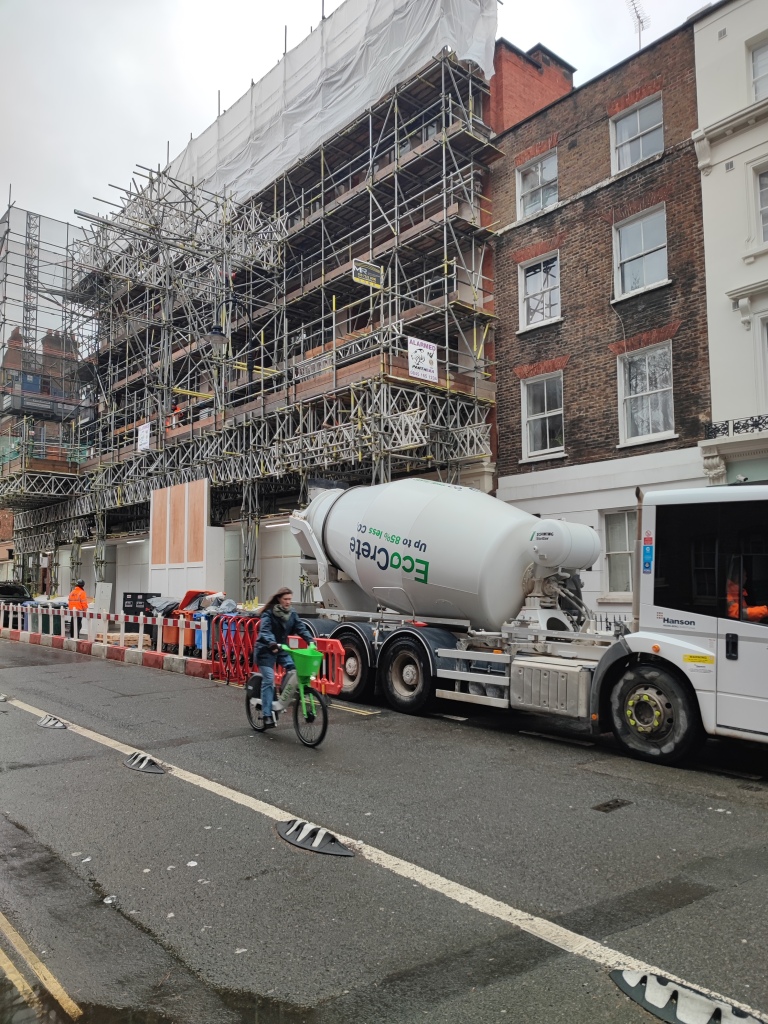
The next stage, material production (A3), includes all industrial processes related to the production of concrete or concrete elements (columns, slabs, etc.). A typical concrete mixing plant consists of a mixer, where cement, aggregates, water, and additives are weighed and mixed in strictly defined proportions to produce concrete with specified technical properties. Aggregates of various particle sizes (gravel, fine gravel, sand) are stored in separate piles. The loader fills the aggregate bins, from which the required amount is taken and transferred by conveyor belt to the mixer. Cement is stored in separate silos depending on its quality and added to the mixer using conveyors, water, and additives using pumps. After the required mixing time, the fresh concrete is loaded onto a concrete mixer and delivered to the construction site. In this stage, mainly energy and fossil fuels necessary for the operation of machines are consumed. As various Environmental Product Declarations show, this process primarily contributes to the production of greenhouse gases for the phase. At this point, we close the cradle-to-gate cycle. The product is ready. Most often, the manufacturer takes responsibility and calculates the environmental impact only up to this stage. 

Madeira concrete infrastrucutre
Concrete infrastructure in Madeira Island.

Stage A4 involves transporting materials or components from the factory to the construction site. Similarly to stage A2, the associated impact is related to the means of transport and represents a marginal part of the impact. I often encounter surprise from designers for whom the construction site is associated with the highest costs. It is likely to be the longest stage and requires the highest investment for architecture and architects. However, from both LCA and LCC (Life Cycle Cost) perspectives, which account for the building’s whole life, we should consider it a small part of the process. 

Summarising stage A, the biggest negative impact is associated with the emission of greenhouse gases and occurs during calcination. Other indicators that negatively affect the environment are caused by transportation and are observed in eutrophication processes, acidification, and summer smog (POCP). 

Concrete and its Life Cycle Part 1 / 3

Concrete as a construction material has become, alongside plastics, the basic material of a new geological epoch. Successive layers of homogeneous mixture of calcium oxide, sand, aggregate, and other materials have covered the surface of the Planet, intersecting contemporary landscapes with highways and railway lines, connecting various points of human activity. Before widespread industrialisation of construction processes, concrete was one of the options used in several regions of the world. Some architects, concerned about the environmental crisis, are seeking alternatives to the material. At the same time, material producers are seeking ways to reduce its environmental impact. However, attempts to improve processes to have less adverse environmental impact have focused on improving production efficiency while increasing profits. The industry related to concrete production has changed, and perhaps even shaped, contemporary architecture. The co-evolution of material and form has been ongoing since the beginning of the 20th century.

We have broken down concrete into its constituent parts throughout its lifecycle to better understand at which stage its negative environmental impact is greatest. We wanted to address the question: How to use concrete in a moment of planetary crisis? The lifecycle is a process consisting of many stages and considered from various aspects. It allows for a better understanding of the relationships that the studied object and its production process create with the surrounding environment. Described since the late 1980s using ISO 14040/14044 standards (Environmental Management – Life Cycle Assessment – Principles and Framework), it is, to the best of our knowledge, the most accurate research methodology. It combines inherent impact, use, and subsequent life of the studied object. This methodology will serve us in demonstrating the relationship and impact of concrete on the environment.

Renovation of an former factory in Porto

Life cycle assessment occurs in four main stages: Production and construction (A), Use (B), End-of-life (C), Second life (D). The stages are also grouped using broader concepts: from cradle to gate, as the name suggests, it considers processes from raw material extraction (e.g., sand excavation) to the production of the finished element in the factory (e.g., reinforced concrete beams). The next concept, cradle-to-grave, considers the end of the element’s use as the final boundary, such as the disposal of elements in a landfill. The last group, cradle-to-cradle, opens the material’s lifecycle to further possibilities, leaving the element or material in continuous circulation. An evaluation of Environmental Product Declarations of concrete products will demonstrate that manufacturers only specify the cradle-to-gate stage and do not investigate the impact of the material during its use or disposal.

Each of these stages can be measured using several indicators, including potential for photochemical ozone formation, eutrophication potential, and consumption of energy from renewable sources. Today, the best-studied aspect concerning architecture and construction is the potential for greenhouse gas emissions, also considered in environmental certifications for buildings. It also relates to planetary boundaries: climate change, which is discussed the most. This leads to the carbon tunnel effect described by Jan Konietzko, which, in 2021, through a single post on LinkedIn, finally became a topic of professional discussion. It reminds us that focusing only on one indicator and reducing it may increase the impact of others. This thought follows the systems theory, upon which planetary boundaries are based. It suggests that all elements operate on the principle of feedback. If one of them goes out of balance, the others do too. Concrete is also discussed by mainly analysing it from the perspective of carbon dioxide emissions. Probably all architects have heard that cement is responsible for 5%-7% of global greenhouse gas emissions. It is difficult for designers to make decisions based solely on this information. The only conclusion that can be drawn is to use less concrete. Despite this, production is increasing year by year.

Housing Estate in Paris, arch. Renée Gailhoustet

To measure the impact in each life cycle stage using indicators, one must first determine the functional unit. Otherwise, we will examine a square meter of monolithic ceiling, which carries a load of 250-300 kg/m2, equally to one carrying a load of 500 kg/m2, or a self-levelling concrete screed with a thickness of 2 cm. Each of these functions requires a different amount of material with different properties. The functional unit also allows for the comparison of different construction methods, for example, ribbed and solid slabs from the perspective of their environmental impact. The unit can also be m3 of concrete mix, which can be used for various applications.

To conduct a material lifecycle analysis, besides defining the system boundaries (e.g., cradle-to-gate), indicators (e.g., Eutrophication Potential), and functional units (e.g., 1m2 of industrial ceiling), a temporal perspective for the study must be determined. Depending on the building elements, a different time horizon is assumed. The structure will remain until the very end of the building’s life. Columns, slabs, and staircases  are elements that are retained even during deep renovations. Structural elements are measured over a 50 or 60-year perspective. This means that after this period, the element is environmentally amortised. If we reuse such a product, for example, a concrete column or a slab, its impact is practically non-existent, only related to transportation and installation in a new location.

Student Housing in Mendrisio (Switzerland), arch. Jachen Koenz

Designing for durability leads to two solutions: designing flexible objects that can be subject to changes primarily in functional layouts and renovation possibilities, and second, designing for disassembly (DfD). Designing for disassembly is based on several principles that allow for easier dismantling of the building and develops the idea of circularity in the technical cycle described by Michael Braungart and William McDonough. It suggests designing components that are easy and intuitive to disassemble, connecting them using mechanical (e.g., screws) and modular elements. In the case of concrete, these are prefabricated elements designed with connectors. To not lose the value of concrete components, subsequent components like floors, windows, and insulations should also be designed and executed following the principles of DfD. Concrete and concrete elements are difficult to recycle and upcycle.

Concrete is produced from cement (binder), aggregates, water, and optional additives, admixtures, or fibres. With a few exceptions, it is used as reinforced concrete. Instead of cement, historically, in vernacular architecture, volcanic ash was used, among other materials.

In conclusion, concrete, like plastics, shapes our world. But its environmental impact requires scrutiny. Analysing its lifecycle through methodologies like ISO standards reveals challenges and opportunities for improvement, urging a holistic approach beyond focusing solely on greenhouse gas emissions. Designing for durability and embracing innovation offer sustainable solutions to mitigate concrete’s environmental footprint, emphasising collective efforts for responsible usage and preservation for a sustainable future. In the next part of the article we will look deeper into all phases of concrete production, to map the hotspots and propose ideas to minimise the negative environmental impact of concrete.

Bus stop in Zurich

Innovations in Building Materials

A Complex Landscape – Part 1/2

Innovations in building materials are far from being a straightforward topic. In the architectural, construction, and engineering industries, the adoption of new materials and construction solutions varies greatly across different building elements. Some construction materials have been in use for decades, if not centuries, without significant changes, while the market for finishing materials, on the other hand, is more flexible and open to innovations, regardless of technical or economic reasons.

In the World of Innovative Building Materials

In the realm of innovative materials, low-emission options have emerged as key players in today’s industry. Regulations such as the new European Taxonomy & EBPD (European Commission & Joint Research Centre., 2019) have begun to mandate carbon dioxide emissions reporting throughout the entire life cycle of assets. This means that investors must understand the impact of their material choices not only during a building’s operational phase but also before the material even arrives at the construction site. The method behind these calculations is life cycle analysis, with a key metric being a material’s potential to contribute to the greenhouse effect, commonly referred to simply as carbon.

This is where materials of biological origin come into play—those derived from plants, such as wood, tree bark, cellulose fibers, or even from fungi used for thermal insulation boards for example (Berge, 2009). Throughout their life cycle, they have the ability to capture carbon from the atmosphere, even if they require industrial processing that reduces this benefit. In the concept of circular life, where we aim to prevent the release of carbon from materials at the end of their life, we can consider both the technical and biological cycles of these materials (Barungart et al., 2008). The technical cycle involves the dismantling of materials and processing for reuse, while the biological cycle considers the possibility of biodegradation, the breakdown of biological materials, and their transformation into nutrients for the growth of new biological materials. This cycle closes at the level of “life,” rather than at a factory.

Certainly, the ideal approach would be to endlessly reuse and recycle materials that have served as sources for construction and are components of existing buildings. However, the majority of these materials have not been designed for longevity or reusability. Many are connected with chemical adhesives or combined in a manner that makes it impossible to grant them a second life. In this article, we will shift our attention to bio-based alternatives—materials that we can integrate into the circular flow of construction materials.

However, materials of biological origin are not the only low-emission solutions. Many traditional construction techniques, dating back to the early 20th century and before, rely on using any material available on the construction site with minimal or zero industrial processing. This typically results in minimal carbon emissions released into the atmosphere. In this article, we discuss innovative materials, their applications, and the challenges associated with them. They are innovative, but that doesn’t always mean they are entirely new. Some of them are traditional solutions that have been displaced by newer, cheaper, and more universal approaches to construction, which often have detrimental effects on the planet and human well-being.

Bio-based materials as an alternative to concrete, steel, and plasterboard.  

Today buildings are primarily made of concrete. Although it’s a material known and used since ancient times, it was composed differently back then. The Romans used a mixture of lime mortar and volcanic ash, known as “pulvis puteolanus,” as their cement. Modern concrete composition was improved with the introduction of Portland cement in the early 19th century, and since then, it has become widely popular, largely replacing native materials.

Each year, 4 billion tons of cement are produced, contributing to up to 8 percent of global annual CO2 production (Habert et al., 2020). The most toxic process occurs during the breakdown of limestone and clay into oxides at temperatures of 1400-1500 degrees Celsius, emitting over half of the carbon dioxide emissions associated with cement production.

However, limestone has played a significant role in the development of construction. Natural binders are used, among other things, for the production of mortar and plaster. Ideally, construction materials should be as minimally processed as possible, with low embedded energy. Wooden elements typically fulfill the structural role in a building due to their strength and low carbon footprint. According to Life Cycle Assessment (LCA) studies, hydraulic mortars based on Natural Hydraulic Lime (NHL) contain at least 15 percent less embedded carbon than cement mortars (Brás & Faria, 2017). In the long-term analysis, NHL-based mortars have a significantly smaller impact on the entire building’s lifespan due to the risk of leaching of NHL mortars. Without wood-based structural components, they are not necessarily less emission-intensive than cement mortars.

In the next part of the article, we are going to bring more details on rammed earth and hempcrete. Two bio-based materials with great potential, used on a small scale by cutting-edge architectural practices and vernacular builders. Learning from the past will be a common denominator of some future materials.

Barungart, Michael., Hoye, Stephen., & McDonough, W. (2008). Cradle to Cradle. Tantor Media;

Berge, B. (2009). The Ecology of Building Materials. Elsevier.

Brás, A., & Faria, P. (2017). Effectiveness of mortars composition on the embodied carbon long-term impact. Energy and Buildings, 154, 523–528. https://doi.org/10.1016/j.enbuild.2017.08.026

European Commission, & Joint Research Centre. (2019). Achieving the cost-effective energy transformation of Europe’s buildings: Combinations of insulation and heating & cooling technologies renovations : methods and data. Publications Office. https://data.europa.eu/doi/10.2760/278207

Habert, G., Miller, S. A., John, V. M., Provis, J. L., Favier, A., Horvath, A., & Scrivener, K. L. (2020). Environmental impacts and decarbonization strategies in the cement and concrete industries. Nature Reviews Earth & Environment, 1(11), 559–573. https://doi.org/10.1038/s43017-020-0093-3

A Few Thoughts on the Decarbonisation of Construction in Portugal

Decarbonization is a new buzzword. It seems like it is replacing sustainability, a very ample, anthropocentric concept*, coined in 1987. Global and European policies are looking to ‘lower greenhouse gas (GHG) emissions’ by 2030 and 2050 [1]. The ongoing COP26 in Glasgow was the best confirmation. We have seen big words and declarations, many times. In recent history, we have seen multiple events [img 01]. Probably the most influential one was the Roman Club Report in 1972 that clearly indicated the Limits of Growth. Many have heard about the Kyoto Protocol signed in 1997, a treaty that aimed to lower (!) GHG emissions. At the COP26 António Guterres, Secretary-General of the United Nations and former Portuguese Prime Minister, is urging to change the business as usual. Can we decarbonize the Portuguese building stock? How to do that?

*Its definition is focused on human wellbeing and future. As per Our Common Future, sustainable development meets the needs of the present without compromising the ability of future generations to meet their own needs.

Image 01. GHG emission and environmental events

But first, a small disclaimer. greenhouse gas emissions are not the only aspect of the actual crisis. We have only started to work with the most tangible aspect of the planetary crisis. Stockholm Resilience Center has clearly shown the complexity of the crisis and the domains we are crossing. [Image 02]. Climate change, which is closely related to GHG emissions, impacts the other limits, but as we can see in the diagram [Image 01], it is not the most urgent. Biogeochemical flows (pathways by which elements like carbon, phosphorus or compounds like water, flow in the environment) and biodiversity loss are two domains that are beyond the zone safe zone. If they cross the point of no return, we should expect disequilibrium of the system and unknown activities in other domains. Biodiversity loss is connected to the territory we occupy. It is an exponential relation: the level of biodiversity increases exponentially with the surface area of uninterrupted, natural land [1].

That is why we prioritise working within already-occupied areas, especially here in Portugal, where 97% of building stock requires renovation [3], the population rate is virtually not growing [4] (do we need more houses for fewer people?) and centres of major cities are low-populated [5]. Also, denser walkable centres mean less carbon emitted during everyday commuting. Most of the relations between planetary domains are beyond the scope of an engineer, we can only act within our professional responsibilities. Everything is connected.

Image 02. Planetary Boundaries, Stockholm Resilience Center

Decarbonization is a very demanding aspect. We at Dosta Tec are researching and prototyping solutions. We have been meeting industry champions and talking with Portuguese companies, and public authorities to understand what their approach is. Many questions popped up: How to lower the energy intensity of housing when we experience energy poverty? How to renovate for thermal comfort, low-energy consumption and simple maintenance? What kind of low-carbon materials can be used for insulation? Do we have them available in Portugal? Is hemp insulation brought from the Czech Republic still sustainable? Can we replace concrete with cross-laminated timber (CLT)? How will climate change influence thermal comfort and heating needs?

Since the EU imposed ESG (Environmental, Social and Government) certification for large companies, they have been asking for services of minimizing energy intensity, carbon emission, and renewables. Will policies help the transition? Are we not going to stack in carbon tunnel vision [image 03]? Well, this is another trap. Certification systems can help but many of them (like LEED or BREEAM) validate only the project. What if the operation of the building doesn’t reflect the project? Some studies [6] have shown that LEED-certified buildings do not outperform conventional ones.

Image 03. Carbon Tunnel Vision, Jan Konietzko

As engineers, we are trapped between “weak sustainability” and “strong sustainability”. Two handy terms were coined by Robert Solow and John Hartwick [7]. The first is focused on the technical solution and the second on policy-making; the first one is human-centred and the second is bio-centred, the first is business as usual the other is to innovate.  As an engineering and technology company working in the field of architecture and construction, we are answering the clients’ and market’s needs, looking to be at the forefront of changes, trying to push from weak sustainability to strong. It might seem that weak sustainability is inferior to strong. Indeed it is, but it is also complementary, as it gives actual solutions that can be implemented almost immediately, and its prototypes and verifies regulations. Many of them have been already checked on the market and require further work.  

The big issue is: how to decarbonize? In Portugal, we need local and verified knowledge, data, qualified policy-makers, clerks, engineers and architects, construction companies, a whole new collection of materials to replace concrete, steel and glass, and procurement schemes that favour low-carbon design. The challenge seems to be enormous and it might bring innovation and an exciting working environment for the next decade.

Adrian Krezlik

co-founder

[1] https://www.europarl.europa.eu/legislative-train/theme-a-european-green-deal/package-fit-for-55

[2] Wilson E. O., Half-Earth: Our Planet’s Fight for Life. Liveright, 2016. 

[3] Buildings Performance Institute Europe, 2017, Energy Performance Certificate Factsheet

[4] INE 2020

[5] Almeida M. A. P. de, “Fighting depopulation in Portugal: Local and central government policies in times of crisis,” Portuguese Journal of Social Science, vol. 17, no. 3, (Sep. 2018), pp. 289–309. 

[6] Scofield J. H., “Efficacy of LEED-certification in reducing energy consumption and greenhouse gas emission for large New York City office buildings,” Energy and Buildings, vol. 67, (Dec. 2013), pp. 517–524. https://doi.org/10.1016/j.enbuild.2013.08.032

Buildings & Renewable Energy Sources

There has been much talk going on in the past decades about decarbonisation of the economy. And as if that wasn’t a big enough problem to tackle, this year brought about an energy crisis. Electricity prices are soaring in Europe. In the Iberian market, the price for 1MWh has reached its second highest historical value. Both these issues mean that energy is not a future problem, but it already exists, alive and kicking.

This doesn’t necessarily mean that we will or should stop all our activities as we know them. It requires a combination of evolving our production processes towards restorative and regenerative methods and limiting, compensating and finally eliminating those activities that are economically or environmentally unfeasible.  Evolving our processes is a practice tightly related to Renewable Energy Sources (RES). Why? Because most activities are not bad for the environment on their own, but the energy they use up is. The emissions related to these energy sources are known as “indirect emissions”. For example, burning coal at home releases CO2 directly, but using an electric heater in a town with a coal power plant creates indirect emissions.

Buildings come into the picture because they provide us with space and infrastructure to replace dirty energy with RES and cut down both direct and indirect greenhouse gas emissions. Doing it at across the built environment  is good for many reasons: 

(a) we can implement quicker domestically than a big, clean energy power plant can be built, 

(b) we help reduce high-voltage electric transmission losses (which may reach at almost 3% in Europe), and

(c) we feel good as we’re in direct contact with our contribution to climate change mitigation, as well as saving money. 

In Portugal, distributed generation of electricity (at home and in industrial buildings) accounts for around 1% of all electricity. This may seem low, but it’s growing very, very fast: in only six years, installed distributed generation capacity has grown by 400%. And it’s already a great choice for saving money.

The first image that comes to mind when thinking about production of heat or electricity is usually a black solar panel on the roof. Solar photovoltaic generation is an excellent choice when thinking about self-managing our energy at home, whether we include a battery bank or not. Even if some parts of the panels’ life cycle have a negative impact on the environment, it remains as a regenerative option. But it’s not the only clean option. We can separate the main domestic RES in the following way:

  • Electricity Production
    • Photovoltaic Cells (PV)
    • Wind Turbine
  • Ambient Heating
    • Biomass & Biogas
    • Passive Solar heating
  • Domestic Hot water Heating
    • Solar Thermal heating
    • Biomass & Biogas
    • Geothermal

Of course, there are more options such as mini-hydroelectric. But let’s stick to the common ones.

We’ve talked about PV. What about wind energy at home? Even if the idea of having a turbine on our roof seems like a disruptive choice, it’s not a very good one. Yes, it’s renewable energy and yes, it’s technically feasible. However, the amount of electricity it provides is extremely low, and producing small turbines has a relatively negative impact on the environment. To quantify: a practical study showed that a small, commercially available wind turbine that can be installed on a rooftop can produce up to 10W of electricity in approximately 3m2[1]. In that same area, a PV panel can generate five times as much. Built-up urban areas can’t really implement this technology in an isolated way, but it may be added to complement a PV system in an area with consistent wind.  Keep in mind, the saying among LCA engineers goes “the bigger the turbine, the greener the electricity”. 

Biomass is slightly more complex. On one hand, the combustion process releases a significant amount of CO2 into the atmosphere. For example, burning wood, which accounts for 18,4% of residential energy use in Portugal, normally releases more of this greenhouse gas than burning coal does, which is surprising to many. However, in terms of climate change mitigation it is considered a clean energy source, as the whole life cycle of the fuel (tree to log to fireplace/furnace) involves a huge amount of carbon capture, which compensates for most of the released carbon at the end of the log’s life. But there are two other issues with this fuel. Firstly, the energy source is not strictly clean: domestic wood burning produces soot, which is very harmful to human health, even if the smoke itself is not a greenhouse gas. Fireplaces and wood stoves may be quaint, but they’re not the best choice when thinking of daily use and overall dependency. Secondly, the proven “net-zero” effect mentioned above is very real, but it has a time lag. Again, it is related to life cycle analysis. Burning a log may be compensated by the growth of a new tree, but studies show this “carbon payback time” ranges between 44 and 104 years after cutting down![2] Other examples of biomass energy sources include agricultural waste and processed wood pellets.

What are the variables to consider when thinking about designing a building that generates electricity and/or heat? Firstly, I should point out that this doesn’t mean isolating from the grid, although it’s possible to do so. “Going solo” is sometimes feasible, but it requires specific conditions and quite some effort. The smarter choice is usually generating a part of electricity or heat, while staying grid-connected. The European grid has adapted to enable houses to conveniently plug into the grid. For example, it’s usually possible to inject excess generated electricity in hours of the day when it is not being used. And you get paid for it.

But coming back to what should be analysed by a building owner or facility manager who wants to access distributed energy resources. The main variables to be considered (I’ve placed examples in the form of questions):

  • Space and building geometry: do the PV panels fit on the roof? Is there room for a solar heating system? 
  • Infrastructure: do existing installations allow for biogas to flow? Is there appropriate ventilation?
  • Cost: is the investment affordable? Can it be financed? Will the utilities pay for excess energy?
  • Site: is the resource available at the site/region? Will constant snow block my PV panels? Is there geothermal energy underground? (the IPCC has a very robust publication on the feasibility of each technology by region [3])
  • Metering: will the energy be measured, for economic and environmental reasons? What metering system will I use?

The variables and questions should spark thought in both the engineers dealing with the installation and the building or house owners that want it. For instance, if we’d like to maximise PV generation in a building, we don’t have to stop at the available space on the roof. We can consider Building Integrated Photovoltaic (BIPV) panels. These are placed on the façade and integrated seamlessly into the structure. Some suppliers even provide choices in colours and shapes, to fit aesthetically into our building. The technology is economically feasible, and available in Europe at average costs of around €450/m2 for facade tiles and €350/m2 for the roof. Compare this to brick ceramic tiles cost at 240€/m2 or roof slates at 130€/m2, add in the electricity generated during the lifetime, and you’ll understand why it’s a great investment, virtually anywhere in Europe [4]. If we’re doing the effort of managing our energy, why not be bold?

Facade of the Copenhagen International School and detail of its blue-green Building-Integrated Photovoltaic (BIPV) panels

 At Dosta Tec, we apply digital tools to model as many RES as we possibly can. The more the alternatives, the more the chances of finding an energy-positive combination. Building energy use has been modelled for some time now, but the combination of these models with simulated heat and electricity generation is a different level of complexity. We love challenges, which is why we explore new technology whenever we possibly can.

Mateo Barbero

co-founder

 ——-

[1] “Design of a micro wind turbine and its economic feasibility study for residential power generation in built-up areas”, Loganthan et al. (2019)

[2] “Does replacing coal with wood lower CO2 emissions? Dynamic lifecycle analysis of wood bioenergy.”, Sterman et al. (2018)

[3] “Residential and Commercial Buildings”, IPCC Report, Chapter 6, page 407 (2021)

[4] “Economic analysis of BIPV systems as a building envelope material for building skins in Europe”, Gholami et al. (2020)

Carbon Budget

According to the new policies of the European Union, all the industries will cut their emissions by at least 55% until 2030 and become almost carbon neutral until 2050. Decarbonization is one of the most important goals of the EU and a tool to combat the climate crisis. For several years there has been a discussion on carbon outsourcing [1]

and it comes back when we want to talk about the carbon budget and a building’s carbon budget. The carbon budget is a term that connects anthropogenic GHG emission reduction with the temperature rise. It limits plans ahead, giving a maximal threshold for GHG emissions. It could be called the total carbon budget too, when referred to the sum of emission of all activities or industries. I am introducing here the term Buildings Carbon Budget (BCB), a chunk of the total carbon budget that is related to Architecture, Engineering and Construction. 

The BCB quantifies all carbon used by the industry, starting from sourcing and manufacturing, through design and construction, operation until demolition. Herewith I am going to focus on the whole life cycle of a building, which includes embodied carbon. And this is a game changer from the point of view of carbon outsourcing. It pushes the construction companies to verify products of their suppliers and manufacturers, to review their production technology, use of energy, transport and more. The BCB may seem to be very similar to the Life Cycle Assessment. And in fact it is based on the LCA, although in contrast to the LCA that assesses and measures impact to compare with other solutions, BCB estimates expenditure for a set period of time, establishes thresholds and looks for minimization of CO2 involved in the project. Similarly to cost budgeting known from economics, it could use the same repertoire of tools: incremental budgeting, budget planning, cutting, carbon flow. I will use the LCA as a starting point and therefore I need to explain it in detail. 

The method to estimate environmental impact of a building we have been following at Dosta Tec so far is described in the ISO norm 14040. It is divided in four parts [fig. 01]: (A) Production and Construction, (B) Operation, (C) End of Life, and (D) Beyond the Building. Different activities are divided into embodied impact and operation impact, and finally, materials can be divided in three groups: cradle-to-gate, cradle-to-grave, and cradle-to-cradle. Let me explain all the components and groups so that the process is as transparent as possible.

Stage A: Production and Construction, embraces all the activities needed for a building to be built. Material sourcing which could be a process that releases a big amount of CO2 if metal ores are

used and the process of getting a pure metal is carbon-expensive; large glazed (flat or curved) surfaces require not only significant amounts of fuel to be produced but also often transport from specialized glass factories. Sometimes thanks to very efficient manufacturing processes, and we are not discussing here the social aspect of that – so-called Social Life Cycle Assessment (S-LCA), in China the production carbon footprint is low, but the question of where does the material come from and how is it transported to the construction site needs to be asked. Sometimes it happens that after burdening a low-carbon product from China with high-carbon transport cost it has still lower embodied-carbon than a local product. 

Stage B is related to the operation of a building, it is related to energy and resources needed for the correct functioning of a building. For example, in commercial buildings in this stage, an important role is played by the facility manager and building integrated systems that monitor the needs of the occupants and can adjust the building’s performance according to their needs. I would like to emphasize that stages A and B are strictly related and it is highly advised that a representative of future occupants participates in the design stage. It helps the design team to make decisions based on the actual needs, and later to pass the information on the best use of the buildings to the future occupants. Today it happens more and more often with BIM 6 level.

Stage C happens when the buildings stop responding to the occupants or market needs, and cannot be reconstructed or renovated more. It is deconstruction and waste processing. This stage seems to be quite outdated since it uses the terms like a waste. Although taking into consideration that most of the buildings in Europe are 30 years or older I recognize that the ideas of circular construction were not introduced yet and many building’s components cannot be recycled or we don’t know how to recycle them.

Finally, Stage D is related to a building afterlife. All the parts of the building are looking for use in another building or to be recycled. Here the topic of Building as Material Banks appears. At all the stages we can set up a yearly or total carbon budget as we set a financial budget. All the activities’ emissions can be measured across their lifecycle. The stages can also be thought of in three groups: cradle-to-gate,  cradle-to-grave, and cradle-to-cradle. The first assesses only the sourcing and production process (i.e. half of Stage A), it is the most common in Environmental Product Declarations (EPD) and is a good tool to compare how the product is manufactured but does not measure the afterlife of the product. If a product is biodegradable it is a great attitude. But typically it gives a false impression while comparing insulation materials such as hemp fibre and XPS. In the cradle-to-gate approach, they might have the same environmental impact, or maybe even XPS has a lower environmental impact, but it does not assess the impact after the afterlife of the product. How many resources are needed to process it or decompose it? Cradle-to-grave (i.e. Stages A to C) assesses the impact of a material that would be processed and disposed of, it means that it will not become a part or raw material for the next cycle of the material nor nutrient. Finally, cradle-to-cradle (i.e. all four stages) defines all the materials that would stay in a closed loop of use. There is no need for sourcing after recovery and recycling. Although it does not mean that there is no carbon footprint in manufacturing or sourcing. It is also important to verify where it is recycled and recovered. Unfortunately, at the present time, the information is not transparent and confirmed yet.

The Buildings Carbon Budget is a measure that helps to meet with the decarbonization of the industry. No doubt it is a difficult task. It is about planning, measuring and integrating all the parties involved in the building lifecycle. Making it a sum of all the activities engages everyone and at the same time helps to avoid a situation when carbon is being outsourced to another stage of a building. By making it a total measure we ensure that every stage and all the parties involved are compromised to stay within carbon limits. The first challenge is to establish actual thresholds for build typologies and locations. In Dosta Tec we are building our internal database when simulating building performance, and embodied energy and carbon to be able to establish a carbon budget for our next projects.

Adrian Krężlik

[1] It is an effect of moving factories and production from Europe to Asia and other places. Companies and factories located in Europe are obliged to meet certain standards, including CO2 emission. Their subcontractors, producing parts, are often located in areas where standards are not high. 

Modelling the effect of windows size

Introduction

Window position, size, and type are variables that affect both visual and thermal comfort. Typically, for better thermal comfort we look to minimize fenestration rate (area of windows on the facade). That is, reduce the size of windows (thermal transmittance is lower for walls, for example, 25 cm brickwall + 5 cm of insulation is about 0.5 W/m2K while double glazed windows can be 1.5 W/m2K). To achieve good visual comfort, multiple factors are taken into consideration: typically we look for large windows (to achieve a high level of daylight availability through the year and to have a connection to the outdoors – well, who doesn’t love having a view) and controllable shadings to prevent glare [1]. Also, operable windows allow a user to control indoor temperature, change air when needed, and connect to the exterior weather conditions. As seen, there are multiple reasons to have large and small windows. Is there an ultimate best size for the windows, their position, and type? No. We are not looking for that. Although we wanted to learn about relations between the size of windows, energy consumption and daylight conditions for the Lisbon Metropolitan Zone. 

Model setup

As with any scientific study that focuses on simulation, we built a virtual model. Such a virtual model of a building is a 3D design that looks to represent typical characteristics of a building typology in a selected region. In our case, it is a detached house in the rather rural part of the metropolitan zone (it means there is no shade cast by neighbouring buildings, and that the urban island effect modifies the site’s climate data to list the most important reasons). The roof ridge is oriented south-north. Windows can be located on all facades, depending on the visual and thermal needs. The house was divided into four rooms, occupying the south, north, east, and west part and each room has only windows belonging to one of the exterior walls.  It essentially means that to comply with visual comfort standards, the fenestration rate for each zone needs to be higher than 0.  Fenestration rate might be a confusing characteristic, it essentially means how much of the facade is transparent. It excludes grills, frames, aprons, etc.The smallest fenestration rate was 30% and the highest 90%, also no shadings for the windows were provided. 

Simulation

We ran 276 options for different window configurations to check which one is the best from the point of view of daylight and energy. It turned out that the relation between the average fenestration rate and the total energy consumption is linear: with a higher fenestration rate comes higher energy consumption.

Fig.01

Another step was to compare some of the 276 solutions:

A, all the facades have the fenestration rate equal to 30%

B, the north facade has the fenestration rate equal to 60%, other facades 30%

C, all the facades have the fenestration rate equal to 60%

D, all the facades have the fenestration rate equal to 90%

According to the European Norm EN 17037, a view outdoors to a landscape and clearance of a minimum of 6 meters is required. The norm specifies the size of the smallest window for 1.00×1.25 m. 

Option A is also the least energy-consuming, while option D is the most energy-consuming. 

First off in Lisbon daylight availability does not seem to be a problem. For a well designed, not very deep interior, there is always enough light regardless of the size of the windows [2]. Just have a look at Fig.02, made for a different study but it clearly illustrates the problems, for a test room with a 45% fenestration rate facing east. Rooms as deep as nine meters will receive enough light for everyday activities and a depth of seven meters or less would be good for work. 

Fig 02. Top view of a room

The problem is rather the overexposure, as strategies A and B illustrate quite well. When looking at the energy consumption, option D requires 60% more than option A to maintain occupant comfort. Overglazing the facade in Portugal does not elevate visual comfort nor thermal comfort. For all the typologies the facade should be solid with carefully studied windows equipped with shading.

Fig.03
Fig.04
Fig.05

Summary

The following study shows that minimization of window size in Portuguese vernacular and contemporary architecture (look at the projects of Souto de Moura or Aires Mateus) is a characteristic that aligns with daylight availability and thermal comfort. It is important to mention and emphasize that view to the outside provides a visual connection with the surroundings, it supplies residents withinformation about the local environment, weather changes and the time of day. Lack of this information can relieve the fatigue associated with long periods of being indoors.

In Scandinavia the lack of light is omnipresent in architectural design, they have been designing to capture as much daylight as possible. Large windows are not a problem anymore since they can be very energy efficient. The tradeoff between the amount of daylight and thermal performance was a topic. Now it is time to tackle this problem in the south when daylight conditions need to negotiate with thermal comfort in another context. 

Adrian Krężlik

co-founder

Continue reading “Modelling the effect of windows size”

Cost-Effectiveness: Getting the Most out of Building Renovation

Lately, there’s been much talk of climate change and climate policy. Even though it’s been in the news and in our conversations since at least 1988, two events have arguably sparked more discussions than ever in the past months: the recent IPCC report (officially called the Sixth Assessment of the Intergovernmental Panel on Climate Change) and the European Union’s Recovery Plan.The first is the output of all the work that the world’s leading climate scientists (under the umbrella of the United Nations) put into studying the current and future situations, and through it they have confirmed what many feared: we are far from the emissions reductions goals that are needed to avoid widespread disasters. The latter is the EU’s plan to restart the economy after the crisis induced by the pandemic and take it through a restorative path, assigning resources for decarbonisation measures in virtually every sector. Each EU country will take  the funding and funnel it into their national budget. It represents the action we need to change the course of our carbon-based economy. As we discussed in our last article, Portugal is chipping in through the Plano de Recuperação e Resiliência.

Within these policies, there is a concept that is growing in importance in building renovation: cost-effectiveness. At a general level, it represents the relationship between how expensive a renovation measure is and how good it is at increasing energy efficiency. In other words: for every euro put into a renovation, how much energy saving will it provide. Think of it as return on investment (ROI) for a specific measure. Cost-optimality is achieved when the selected renovation measure maximises the ROI.

Through the Energy Performance of Buildings Directive (EPBD), the EU requires countries to not only take energy efficiency measures in their building stocks, but also 

set cost-optimal minimum energy performance requirements for new buildings, for existing buildings undergoing major renovation, and for the replacement or retrofit of building elements like heating and cooling systems, roofs and walls”.

 In short, it restricts the measures that may be taken to increase energy efficiency for a good cause. It ensures that the money and effort put into the national renovation plans is invested smartly. The methodology that must be used to reach this cost-optimal level is standardised and described in detail, but I’ll keep it a bit simpler in this article for the sake of being practical.

But enough with high-level policy stuff. What are the implications of all this in individual decision-making? When faced with the need to renovate, you will probably (definitely) want to get the most out of your money, even if you already know that the value of your property will certainly rise if it’s more energy-efficient.  At Dosta Tec we have the expertise for providing alternatives for building renovation, and this is how it goes in terms of cost-effectiveness: we look at the performance of some possible (and reasonable) measures that can be taken, scattered across a “investment vs. energy cost” graph, and from it read the cost-effectiveness of each option. Note that the “return” part of our ROI represents the savings in energy use that we enjoy when increasing our house or building’s energy efficiency. The graph below shows an example of this, where we produced 216 alternatives for insulating a house in Lisbon, with different combinations of materials, thickness, and design. The point at the top-left is the “baseline” case in which no renovation is done.

Energy cost during 50 years for each of the 216 alternatives

If we look at two points with the same amount of investment, the point that is lower in the graph represents a more cost-effective solution, since we are getting a larger benefit with the same amount of money. But to avoid drowning in data, we can look at specific clusters of alternatives. For instance, we may want to only see how a specific material performs. The graph below shows Extruded Polystyrene foam (XPS) wall insulation, a popular wall-insulating material. And the graph after that one shows how organic hemp insulation performs under the same conditions.

Three alternatives for extruded polystyrene wall insulation
One alternative for hemp wall insulation

The trendline and its formula are not just us being nerds, they are essential: the steeper the line, the more cost-effective a material is. See how the hemp curve is much steeper? This is because this material provides more savings for each euro spent. However, it also has only one graph point: sometimes there are not many available alternatives to choose from for a specific material. So, in this case, choosing hemp is more cost-effective, but XPS provides more options. Experience has shown us that this wiggle room is valuable, since this digital model represents a real-life renovation project, and in real life we can’t always optimise as we’d like to. It’s important for me to note here that we are now focusing on cost-effectiveness, but real renovation projects may bring things like the life-cycle environmental impact of materials into the decision-making. In this case, XPS has significant global warming potential, while hemp’s is negative (it’s regenerative!).

So which is the cost-optimal alternative? Here is where the EPBD adapts its methodology to the real world. EU member states submitted their detailed studies on cost-optimality for building performance measures in 2015 (both cost and energy use vary greatly across countries). They accepted that “many member states find a cost-optimal range of measures by combining the building envelope and the technical systems rather than an individual optimal point.” This was expected. A single, maximum, isolated point representing the best technology and materials sounds and looks great, but we don’t need a team of engineers to tell us that it might not be always feasible. Cost-optimality is something to strive for, but rarely achieved. This is not negative – on the contrary, it’s a great way of guiding our choices.

Cost-optimality is also strongly affected by tax policy, which as in any area of the economy, affects costs and thus cash flows and payback times. For example, all insulation materials have the same VAT value in Portugal, but this could change in the near future. Looking at all the activities around the New European Bauhaus we can observe a significant interest in biomaterials.

Decision-making in building performance is a complex process as there are multiple variables to optimise for. Cost-efficiency, indoor thermal comfort, environmental impact – they all play a role in the trade-off game that is a renovation project. We all want to invest smartly, have a positive impact on the environment, and live well. The more we understand each concept, the easier it becomes to make the right decisions and join the path towards regenerating the environment.

Mateo Barbero

co-founder

Recovery and Resilience Plan

The pandemic of COVID-19 has changed the European economy. For several months some of the industries were frozen, many had to shift their business model and offer new services, and digitalization became a fact – not a future plan. As a response to the economic crisis, the European Commission decided to launch ‘the largest stimulus package ever’ – NextGenerationEU. This is not only a recovery plan, but an attempt to transform the economy into digital and green. Each Member State was responsible for preparing a national plan to allocate funds and create a bright scenario for the European Community. In Portugal, it is called the Recovery and Resilience Plan (Plano de Recuperação e Resiliência) and operates an outstanding budget of 16 644 million euros. It is developed in three axes: Resilience, Climatic Transition and Digital Transition. Two out of twenty components are related directly to construction: Housing and Energy Efficiency in Buildings [1]. In this article, I will focus on the domain in which Dosta Tec has the biggest expertise: energy efficiency.

The component Energy Efficiency in Buildings looks to promote decarbonization in the residential sector, favouring urban rehabilitation and increased energy efficiency in buildings, promoting progressive electrification of the sector and the use of more efficient equipment, and combating energy poverty. Among multiple goals to be achieved, the following stand out:

  • reduction of greenhouse gas emissions by reducing very significant energy consumption,
  • reduction of energy bill and dependence,
  • reduction of energy poverty, 
  • improvement of levels of comfort and indoor air quality,
  • promotion of labour productivity, as a result of the increased Environmental Indoor Quality (EIQ) and the mitigation of occupant illness situations,
  • extending the life of buildings and increasing their resilience through the improvement of buildings and their characteristics (renovation),
  • use of materials that can be manufactured in Portugal with the use of intensive and specialized local manpower;

Apart from quite standard goals and conclusions like reducing energy use, it looks to connect knowledge and research from multiple disciplines, such as productivity and comfort. In fact, multiple studies have proved the relation between productivity and EIQ [2] [3]. Although in Portugal, this topic is not well explored[4] nor measured properly. It seems that the component creates a great opportunity to focus on this and other vaguely researched topics. Also, the goals point out the importance of embodied energy and durability. It promotes renovation as a simple way to enhance the energy efficiency of the existing building stock.  Finally, it draws a sharp relation between architecture, the circular economy and local materials. 

Renovation of a façade in Porto, 2021

According to the plan, the investment would focus on the three following actions:

  • Long Term Strategy for Building Renovation (Estratégia de Longo Prazo para a Renovação de Edifícios – ELPRE). A reform approved in the National Energy and Climate Plan (Plano Nacional Energia e Clima 2021-2030) [5] is going to promote the energy-efficient renovations of the Portuguese buildings stock, paying attention to residents’ comfort. The plan includes the Road Map with indicative measures and targets for 2030, 2040 and 2050 developed in seven domains:
    1.  Building renovation: the creation of an adequate financial framework – reorientation of financing lines for the energy renovation of the buildings envelope, revision of the current Energy Efficiency Program in Public Administration (according to EBPD), better environmental performance of buildings,
    2. Development and promotion of smart building envelopes, with a focus on research and technological innovation, 
    3. Strengthening the normative and regulatory framework for energy certification of buildings, which includes, among other measures, the labelling of products and/or services related to the energy renovation of buildings, the use of energy certificates as an access mechanism for financing or other types of benefits, and qualification of the energy class of buildings as an incentive or conditioning factor in the rental market,
    4. Closing gaps in training and professional qualification in the field of performance of buildings, in terms of energy efficiency and resources, 
    5. Actions to combat energy poverty, reduction of energy consumption charges and providing support to the most vulnerable households in the energy renovation of their homes through, through the provision of mechanisms for financing and tax benefits, 
    6. Actions to ensure the information and awareness of citizens and companies, public and private, for the benefits arising from the renovation of buildings through,
    7. Implementation of a set of indicators and mechanisms to monitor ELPRE’s progress and ascertain the respective practical results in the energy performance of the buildings,
       
  • Resource Efficiency Program in Public Administration 2030 (Programa de Eficiência de Recursos na Administração Pública 2030 – ECO.AP 2030) The  program aims to promote the decarbonization and energy transition of activities carried out by the State, contributing to the goals of reducing GHG emissions, reducing energy consumption by reinforcement of energy efficiency, the incorporation of renewables in the gross final consumption of energy, as well as promoting the efficient management of resources in the Public Administration,
  • National Strategy for Combating Energy Poverty (Estratégia Nacional para o Combate à Pobreza Energética) strengthens the role of the citizen as an active agent in decarbonization and energy transition, fighting energy poverty, creates instruments for the protection of vulnerable citizens and promotes the active involvement of citizens and territorial enhancement.

The investments to be implemented amount to 620 M€ and will allocate the resources in three groups: energy efficiency in residential buildings (300 M€), energy efficiency in central public administration buildings (250 M€), energy efficiency in service buildings (70 M€). Energy efficiency in residential buildings is divided into the following specific tasks:

  • Passive improvements at the level of the envelope, e.g., thermal insulation of walls, thermal insulation of roofs and glazing,
  • Active improvements, eg., HVAC systems for heating and/or cooling and SWH,
  • Energy generation systems and measuring through, e.g., electric energy generation systems from renewable sources, renewable energy community, 
  • Interventions aimed at water efficiency, including the replacement of equipment with more efficient equipment,
  • Interventions that promote biomaterials, recycled materials, natural-based solutions, green facades and roofs and bioclimatic architecture solutions, on urban buildings or their existing autonomous fractions;

Some of the implementations are already functioning, like CasA+, and they clearly reflect the legislation.

Deep Renovation in Olhão, 2020


The Recovery and Resilience Plan draws an interesting scenario for the next years of development of Portugal, importantly next to the Renovation Wave Directive and New European Bauhaus it shows a new way of development of Portuguese architecture: renovation. Some of the activities repeat in different actions, which essentially mean that these aspects are crucial and multifaceted, and funds will be allocated by different rules. With more than 97% of building stock with renovation potential, it sends clear information to the industry: renovate efficiently. 

Adrian Krezlik

co-founder

————————

[1] Ministério do Planeamento, “Plano de Recuperação e Resiliência,” Lisbon, Version 2.0, Feb. 2021.

[2] Wyon D., “Indoor Environmental Effects on Productivity,” (Jan. 1996).

[3] Heschong L., “Daylighting in Schools An Investigation into the Relationship Between Daylighting and Human Performance Condensed Report,” (1999). https://doi.org/10.13140/RG.2.2.31498.31683

[4] Macedo A. et al., “Characterization of Indoor Environmental Quality in Primary Schools in Maia: A Portuguese Case Study,” Human and Ecological Risk Assessment: An International Journal, vol. 19, no. 1, (Jan. 2013), pp. 126–136. https://doi.org/10.1080/10807039.2012.683751

[5] Council of Ministers Resolution, “Plano Nacional Energia e Clima (PNEC 2030),” 2019.

Lo-Tech Solutions: Solar Water Heaters and their Embodied Carbon

Dr. Harry Zvi Tabor was a British-Israeli physicist who is known for pioneering work in the field of solar energy in Israel. His work isn’t only relevant in the academic world, but had a big impact on the energy use of israeli cities. He developed a solar water heater that is the most common in the country, with 90% of dwellings getting their hot water from his technology (or similar) [1]. Locals know it as the “dud shemesh’’, and it’s the cornerstone of heating energy efficiency in Israel. Of course, other measures have been taken since the ’80s, when the heater was popularised.

The fact that makes this success story especially good is that it’s not based on high-tech research & development, which normally looks to turn expensive, cutting-edge solutions into economically viable alternatives. The solar heating landscape in Israel did, however, sprout from innovation.

90% of Israeli dwellings depend on solar heating devices for their hot water (Miriam Alster/FLASH90)

The ’70s oil crisis pushed an oil-dependent country (which has improved, but is still lagging behind in renewable energy) into a very common problem at the time, and they turned to a resource that is massively available in the country: solar energy. Many homes do have both electric heaters and solar heaters, in case the sun isn’t shining — which is rare for a city like Tel Aviv, with over 300 sunny days during the year, which translate in abundance of solar radiation. We can draw similarities between the current climate emergency and the ’70s oil crisis: both demand an urgent change in energy policy and high innovation in the energy matrix (albeit for different reasons: back then it was a massive surge in costs, now it’s due to rising surface temperatures). We can learn from the way Israel navigated the change when confronted with their black swan.

Solar heaters around the world typically consist of a collector (the flat part) that receives solar radiation and heats up water that circulates through it. The water is then stored in a tank that is coupled to the collector, where it stays warm for as long as the weather allows it to. The collector is not always present in the set up, as is common in less developed areas.

Basic functioning of a Solar Water Heater

This technology is economically feasible (with as little as a three-year payback time [2]). It also pays back the user very quickly when measured only by “embodied energy” — meaning energy used in setting it up is easily paid back in two or three years (this is a good measure as it is independent of energy price). But what is its real environmental cost? As we usually do at Dosta Tec, we resort to emissions through Life Cycle Assessment (LCA) to answer this question. It turns out, the “environmental payback time” is also extremely reasonable. In other words, the yearly energy savings provided by solar water heaters are enough to offset the carbon emissions incurred during mining, manufacturing, and installation — and this happens quite fast too.

As noted in a previous article of ours, embodied carbon is strongly dependent on both a country’s energy mix (the “cleaner” the grid’s sources are, the milder the positive impact a solar heater will have) and the availability of solar heaters in a particular location. The more they travel, the more carbon they embody. Even accounting for these variations (and uncertainties), solar heaters are an exceedingly good idea, way more often than not [3]. Their payback time is so small, that they’re a great choice even when accounting for the installation of back-up electric heaters. In Portugal, the price of a simple solar heater with an efficient heat collector can start at as little as 1000€, with a proven environmental payback time of less than three years [4].

When choosing technology (or making any engineering decision, really) we always compare alternatives. The most robust solutions always come from scanning the available options. In this sense, a study from the University of Liverpool [5] compared technologies that are usually used to increase energy performance in buildings. Solar Thermal (ST, outlined in green in the graph below), is significantly better than, for instance, Solar Photovoltaic. They achieved this by measuring the carbon embodied during the whole life cycle (typically using cradle-to-grave strategy) and dividing by a standardised unit of energy efficiency, known as a Functional Unit (FU). This might sound confusing, but just think of it like this: it costs so much carbon to build and install this technology, and we divide it by how much energy it saves during its lifetime. This way we can compare technologies in a cost/benefit manner. The graph speaks for itself.

Comparing building-efficiency technology by embodied carbon equivalent [5]. GSHP: ground source heat pump | ASHP: air source heat pump | ST: solar thermal | MVHR: mechanical ventilation and heat recovery | SPV: solar photovoltaic | LED: light-emitting diode (lighting)

So, why doesn’t everyone living where the sun shines use them? There are multiple barriers, on several fronts, to implement this technology: legislative, cultural, and organisational. Life cycle assessment studies and the concept of embodied carbon are relatively new to both policy and industry (in the context of the fossil fuel problem). And we sometimes tend to think all innovation must be at the forefront of new technology. Efficient, low-tech solutions often appear when necessity calls, such as an oil crisis, or just general lack of economic resources, as happens in many developing countries. As we keep pushing the boundaries of energy efficiency towards regeneration, we should remember that the energy problem is complex and shouldn’t expect to solve it with a single, high-tech silver bullet. Instead, why not source a portion of our knowledge and practices from simpler highly efficient options? We might just hit the right technology mix and move closer to a real, cost-efficient solution.

Mateo Barbero

co-founder

— — — — — — — — —

[1] https://www.reuters.com/article/idUS311612153620110318

[2] Soteris Kalogirou, “Thermal performance, economic and environmental life cycle analysis of thermosiphon solar water heaters”, Solar Energy, Volume 83, Issue 1, 2009

[3] Battisti, R., Corrado, A.: Environmental assessment of solar thermal collectors with integrated water storage, in Journal of Cleaner Production 13, p. 1295–1300, 2005

[4] Fernandes, V. et al., “Life cycle assessment of solar thermal systems”, AHS Sustainable Housing Construction 2014

[5] Finnegan S. et al, “The embodied CO2e of sustainable energy technologies used in buildings: A review article”, Energy and Buildings, Volume 181, 2018, Pages 50–61